1\环境
2安装kibana
[root@n8 ~]#
[root@n8 ~]# ll
总用量 235284
-rw——-. 1 root root 1331 7月 14 17:40 anaconda-ks.cfg
-rw-r–r– 1 root root 240920951 8月 22 13:04 kibana-7.3.0-x86_64.rpm
-rw-r–r– 1 root root 153 8月 15 10:23 ntp.conf
[root@n8 ~]# yum install -y kibana-7.3.0-x86_64.rpm
已加载插件:fastestmirror
正在检查 kibana-7.3.0-x86_64.rpm: kibana-7.3.0-1.x86_64
kibana-7.3.0-x86_64.rpm 将被安装
正在解决依赖关系
–> 正在检查事务
—> 软件包 kibana.x86_64.0.7.3.0-1 将被 安装
–> 解决依赖关系完成
依赖关系解决
=================================================================================================================================================================================================================================================
Package 架构 版本 源 大小
=================================================================================================================================================================================================================================================
正在安装:
kibana x86_64 7.3.0-1 /kibana-7.3.0-x86_64 626 M
事务概要
=================================================================================================================================================================================================================================================
安装 1 软件包
总计:626 M
安装大小:626 M
Downloading packages:
Running transaction check
Running transaction test
Transaction test succeeded
Running transaction
正在安装 : kibana-7.3.0-1.x86_64 1/1
验证中 : kibana-7.3.0-1.x86_64 1/1
已安装:
kibana.x86_64 0:7.3.0-1
完毕!
[root@n8 ~]#
2配置kibana
[root@n8 ~]# cd /etc/kibana/
[root@n8 kibana]# ll
总用量 8
-rw-r–r– 1 root root 5150 7月 25 03:07 kibana.yml
[root@n8 kibana]# cp kibana.yml kibana.yml.bak
[root@n8 kibana]# vim kibana.yml
[root@n8 kibana]# grep “^[a-Z]” /etc/kibana/kibana.yml
server.port: 5601
server.host: “10.1.24.186”
elasticsearch.hosts: [“http://10.1.24.172:9200”]
i18n.locale: “zh-CN”
3\启动并验证
[root@n8 kibana]#
说明
[root@xx ~]# grep “^[a-Z]” /etc/kibana/kibana.yml
server.port: 5601
server.host: “0.0.0.0”
elasticsearch.hosts: [“http://x.x.x.x:9200”]
i18n.locale: “zh-CN” #kibana7官方支持中文
[root@n8 kibana]# systemctl start kibana
[root@n8 kibana]# systemctl status kiabana
Unit kiabana.service could not be found.
[root@n8 kibana]# systemctl status kibana
● kibana.service – Kibana
Loaded: loaded (/etc/systemd/system/kibana.service; disabled; vendor preset: disabled)
Active: active (running) since 四 2019-08-22 13:13:51 CST; 9s ago
Main PID: 10068 (node)
Tasks: 11
Memory: 228.8M
CGroup: /system.slice/kibana.service
└─10068 /usr/share/kibana/bin/../node/bin/node –no-warnings –max-http-header-size=65536 /usr/share/kibana/bin/../src/cli -c /etc/kibana/kibana.yml
8月 22 13:13:51 n8 systemd[1]: Started Kibana.
8月 22 13:13:54 n8 kibana[10068]: {“type”:”log”,”@timestamp”:”2019-08-22T05:13:54Z”,”tags”:[“info”,”plugins-system”],”pid”:10068,”message”:”Setting up [1] plugins: [translations]”}
8月 22 13:13:54 n8 kibana[10068]: {“type”:”log”,”@timestamp”:”2019-08-22T05:13:54Z”,”tags”:[“info”,”plugins”,”translations”],”pid”:10068,”message”:”Setting up plugin”}
8月 22 13:13:54 n8 kibana[10068]: {“type”:”log”,”@timestamp”:”2019-08-22T05:13:54Z”,”tags”:[“info”,”plugins-system”],”pid”:10068,”message”:”Starting [1] plugins: [translations]”}
[root@n8 kibana]# ss -ntlp | grep 5601
LISTEN 0 128 10.1.24.186:5601 *:* users:((“node”,pid=10068,fd=18))
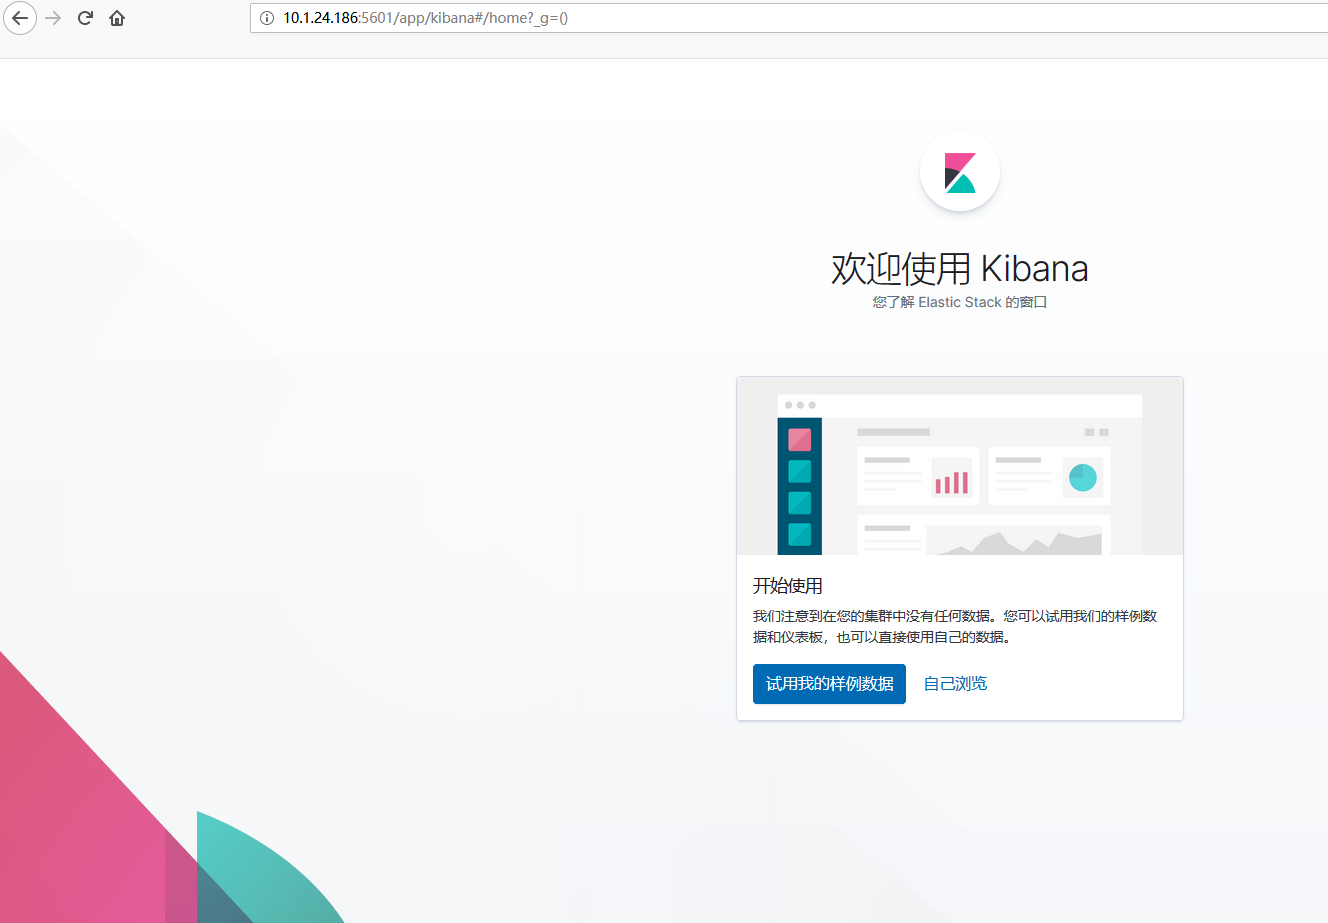
4\登陆浏览器查看kibana状态
5\配置logstash收集系统日志
在 Logstash 服务器配置片段文件,将系统日志发送给 ES 服务器
[root@n7 ~]# cd /etc/logstash/conf.d/
[root@n7 conf.d]# pwd
/etc/logstash/conf.d
[root@n7 conf.d]# ls
[root@n7 conf.d]# vim system-log.conf
[root@n7 conf.d]# ll
total 4
-rw-r–r– 1 root root 257 Aug 22 01:23 system-log.conf
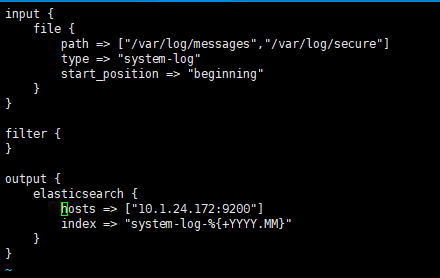
[root@n7 conf.d]# cat /etc/logstash/conf.d/system-log.conf
input {
file {
path => [“/var/log/messages”,”/var/log/secure”]
type => “system-log”
start_position => “beginning”
}
}
filter {
}
output {
elasticsearch {
hosts => [“10.1.24.172:9200”]
index => “system-log-%{+YYYY.MM}”
}
}
[root@n7 conf.d]#
[root@n7 conf.d]# chmod 644 /var/log/messages
[root@n7 conf.d]#
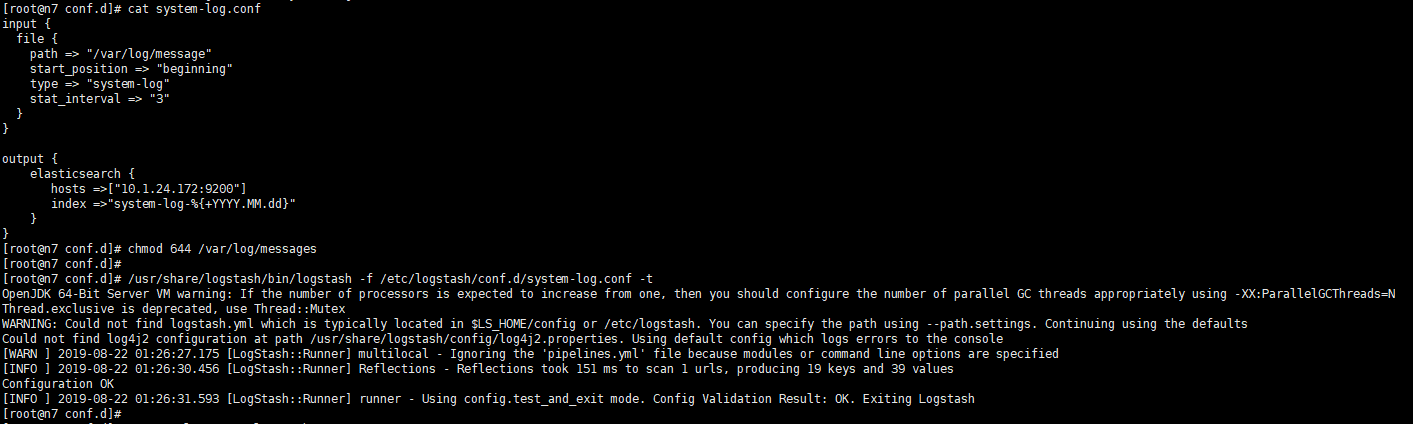
说明如下
[root@xx conf.d]# vim system-log.conf
input {
file {
path => “/var/log/message” #日志路径,默认权限为600,需要进行授权
start_position => “beginning” #第一次从头收集,之后从新添加的日志收集
type => “system-log” #定义事件唯一类型
stat_interval => “3” #日志收集的间隔时间
}
}
output {
elasticsearch {
hosts =>[“10.1.24.172:9200″] #输出到ES服务器
index =>”system-log-%{+YYYY.MM.dd}”
}
}
5.1检测语法
[root@n7 conf.d]# /usr/share/logstash/bin/logstash -f /etc/logstash/conf.d/system-log.conf -t
OpenJDK 64-Bit Server VM warning: If the number of processors is expected to increase from one, then you should configure the number of parallel GC threads appropriately using -XX:ParallelGCThreads=N
Thread.exclusive is deprecated, use Thread::Mutex
WARNING: Could not find logstash.yml which is typically located in $LS_HOME/config or /etc/logstash. You can specify the path using –path.settings. Continuing using the defaults
Could not find log4j2 configuration at path /usr/share/logstash/config/log4j2.properties. Using default config which logs errors to the console
[WARN ] 2019-08-22 01:26:27.175 [LogStash::Runner] multilocal – Ignoring the ‘pipelines.yml’ file because modules or command line options are specified
[INFO ] 2019-08-22 01:26:30.456 [LogStash::Runner] Reflections – Reflections took 151 ms to scan 1 urls, producing 19 keys and 39 values
Configuration OK
[INFO ] 2019-08-22 01:26:31.593 [LogStash::Runner] runner – Using config.test_and_exit mode. Config Validation Result: OK. Exiting Logstash
5.2重启logstash
[root@n7 conf.d]# systemctl restart logstash
[root@n7 conf.d]# systemctl status logstash
● logstash.service – logstash
Loaded: loaded (/etc/systemd/system/logstash.service; disabled; vendor preset: disabled)
Active: active (running) since Thu 2019-08-22 01:27:27 EDT; 1min 6s ago
Main PID: 8443 (java)
CGroup: /system.slice/logstash.service
└─8443 /bin/java -Xms1g -Xmx1g -XX:+UseConcMarkSweepGC -XX:CMSInitiatingOccupancyFraction=75 -XX:+UseCMSInitiatingOccupancyOnly -Djava.awt.headless=true -Dfile.encoding=UTF-8 -Djruby.compile.invokedynamic=true -Djruby.jit.thres…
Aug 22 01:28:21 n7 logstash[8443]: [2019-08-22T01:28:21,941][INFO ][logstash.outputs.elasticsearch] New Elasticsearch output {:class=>”LogStash::Outputs::ElasticSearch”, :hosts=>[“//10.1.24.172:9200″]}
Aug 22 01:28:22 n7 logstash[8443]: [2019-08-22T01:28:22,089][INFO ][logstash.outputs.elasticsearch] Using default mapping template
Aug 22 01:28:22 n7 logstash[8443]: [2019-08-22T01:28:22,335][WARN ][org.logstash.instrument.metrics.gauge.LazyDelegatingGauge] A gauge metric of an unknown type (org.jruby.specialized.RubyArrayOneObject) has been create for key: cluster_u…
Aug 22 01:28:22 n7 logstash[8443]: [2019-08-22T01:28:22,354][INFO ][logstash.javapipeline ] Starting pipeline {:pipeline_id=>”main”, “pipeline.workers”=>1, “pipeline.batch.size”=>125, “pipeline.batch.delay”=>50, “pipe…:0x2adc5664 run>”}
Aug 22 01:28:22 n7 logstash[8443]: [2019-08-22T01:28:22,360][INFO ][logstash.outputs.elasticsearch] Attempting to install template {:manage_template=>{“index_patterns”=>”logstash-*”, “version”=>60001, “settings”=>{“index…sage_field”=>{“pat
Aug 22 01:28:23 n7 logstash[8443]: [2019-08-22T01:28:23,691][INFO ][logstash.inputs.file ] No sincedb_path set, generating one based on the “path” setting {:sincedb_path=>”/var/lib/logstash/plugins/inputs/file/.since…var/log/message”]}
Aug 22 01:28:23 n7 logstash[8443]: [2019-08-22T01:28:23,865][INFO ][logstash.javapipeline ] Pipeline started {“pipeline.id”=>”main”}
Aug 22 01:28:24 n7 logstash[8443]: [2019-08-22T01:28:24,173][INFO ][logstash.agent ] Pipelines running {:count=>1, :running_pipelines=>[:main], :non_running_pipelines=>[]}
Aug 22 01:28:24 n7 logstash[8443]: [2019-08-22T01:28:24,244][INFO ][filewatch.observingtail ] START, creating Discoverer, Watch with file and sincedb collections
Aug 22 01:28:25 n7 logstash[8443]: [2019-08-22T01:28:25,572][INFO ][logstash.agent ] Successfully started Logstash API endpoint {:port=>9600}
Hint: Some lines were ellipsized, use -l to show in full.
[root@n7 conf.d]# ss -ntlp
State Recv-Q Send-Q Local Address:Port Peer Address:Port
LISTEN 0 128 *:22 *:* users:((“sshd”,pid=6754,fd=3))
LISTEN 0 100 127.0.0.1:25 *:* users:((“master”,pid=6905,fd=13))
LISTEN 0 128 :::22 :::* users:((“sshd”,pid=6754,fd=4))
LISTEN 0 100 ::1:25 :::* users:((“master”,pid=6905,fd=14))
LISTEN 0 50 ::ffff:10.1.24.71:9600 :::* users:((“java”,pid=8443,fd=86))
[root@n7 conf.d]# ss -ntlp | grep 9600
LISTEN 0 50 ::ffff:10.1.24.71:9600 :::* users:((“java”,pid=8443,fd=86))
[root@n7 conf.d]#
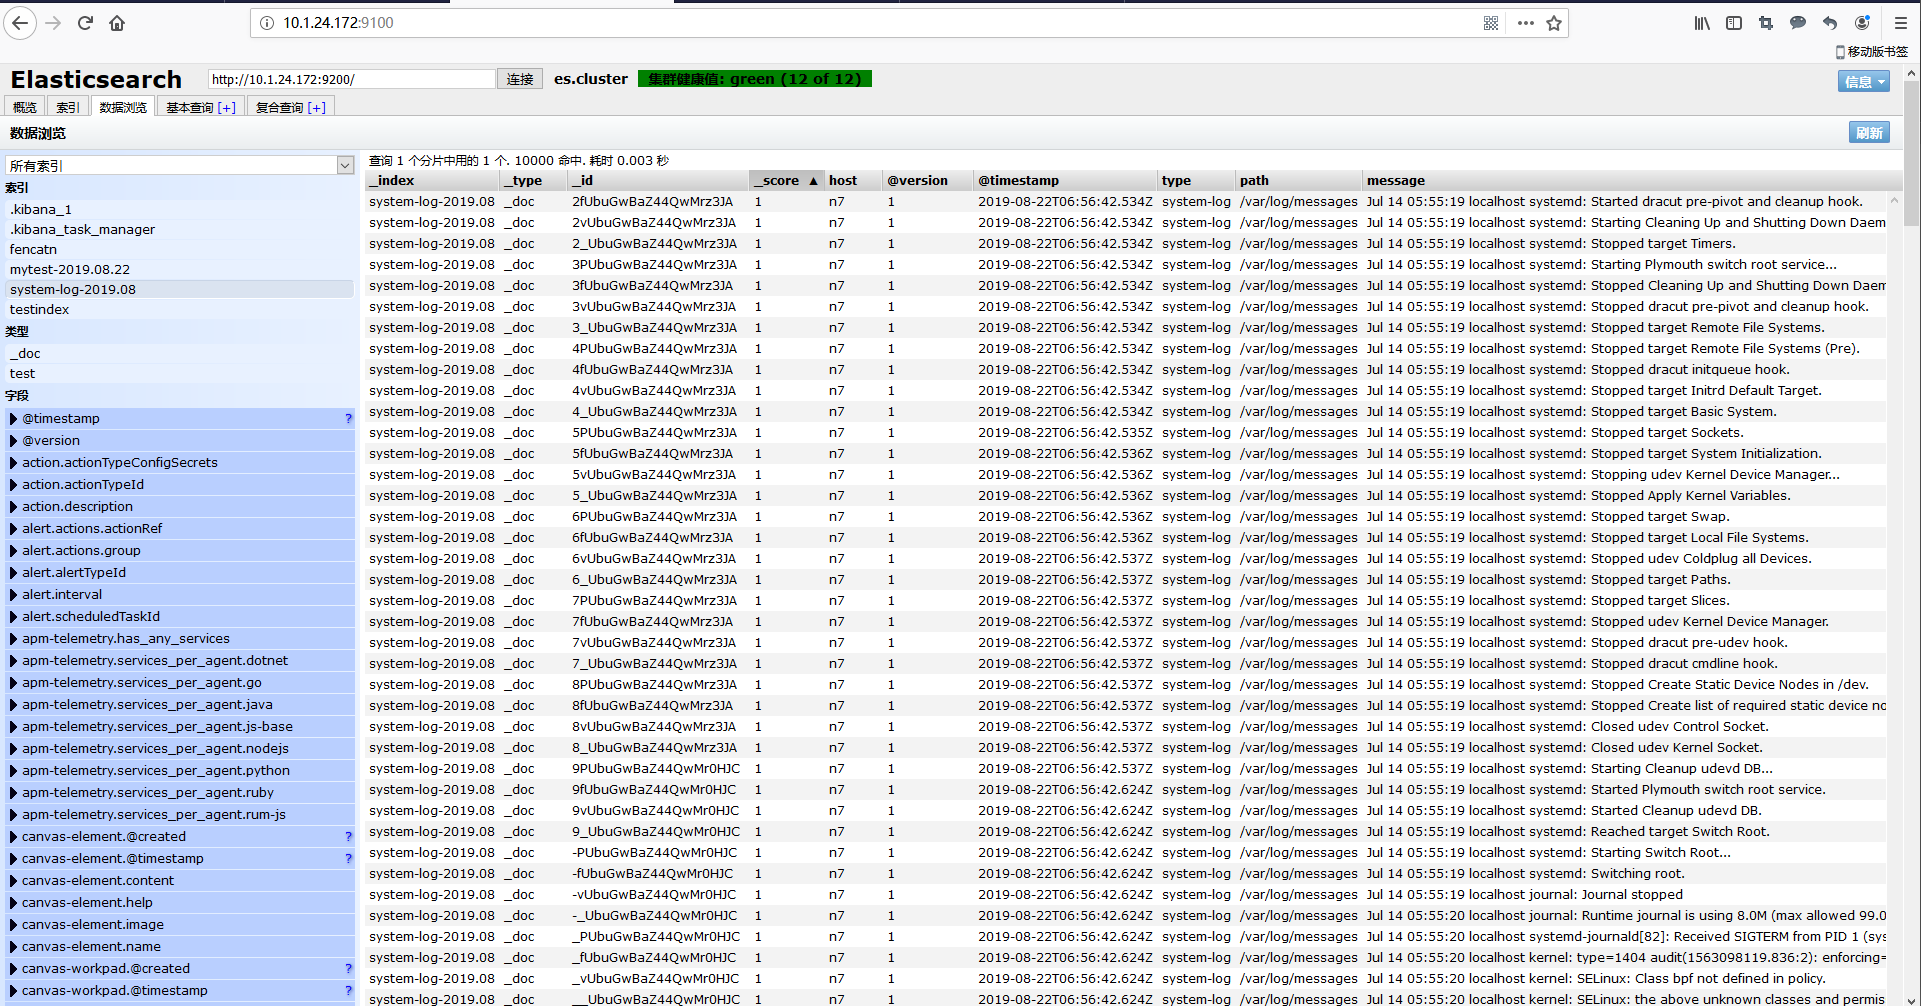
6\在ES插件head页面查看
打开网页访问
http://10.1.24.172:9100/