
本文根据https://hacpai.com/article/1559892603869修改
前言
什么是 ELK
通俗来讲,ELK 是由 Elasticsearch、Logstash、Kibana 三个开源软件的组成的一个组合体,这三个软件当中,每个软件用于完成不同的功能,ELK 又称为 ELK stack,官方域名为 stactic.co
ELK stack 的主要优点有如下几个:
(1)处理方式灵活: elasticsearch 是实时全文索引,具有强大的搜索功能
(2)配置相对简单:elasticsearch 全部使用 JSON 接口,logstash 使用模块配置,kibana 的配置文件部分更简单。
(3)检索性能高效:基于优秀的设计,虽然每次查询都是实时,但是也可以达到百亿(4)级数据的查询秒级响应。
(5)集群线性扩展:elasticsearch 和 logstash 都可以灵活线性扩展
(6)前端操作绚丽:kibana 的前端设计比较绚丽,而且操作简单
什么是 Elasticsearch
Elastic Search 是一个基于 Lucene 的开源分布式搜索服务器。它的特点有:分布式,零配置,自动发现,索引自动分片,索引副本机制,RESTful 风格接口,多数据源,自动搜索负载等。它提供了一个分布式多用户能力的全文搜索引擎,基于 RESTful web 接口。Elasticsearch 是用 Java 开发的,并作为 Apache 许可条款下的开放源码发布,是非常流行的企业搜索引擎。设计用于云计算中,能够达到实时搜索,稳定,可靠,快速,安装使用方便。
在 elasticsearch 中,所有节点的数据是均等的。
什么是 Logstash
Logstash 是一个完全开源的工具,它可以对你的日志进行收集、过滤、分析,支持大量的数据获取方法,并将其存储供以后使用(如搜索)。说到搜索,logstash 带有一个 web 界面,搜索和展示所有日志。一般工作方式为 c/s 架构,client 端安装在需要收集日志的主机上,server 端负责将收到的各节点日志进行过滤、修改等操作在一并发往 elasticsearch 上去。
什么是 Kibana
Kibana 是一个基于浏览器页面的 Elasticsearch 前端展示工具,也是一个开源和免费的工具,Kibana 可以为 Logstash 和 ElasticSearch 提供的日志分析友好的 Web 界面,可以帮助您汇总、分析和搜索重要数据日志。
一、elasticsearch 部署:
1、环境准备
n5\6用作ES集群 n7装LOGSTASH n8装kibana
[root@n6 elasticsearch]# cat /etc/hosts
127.0.0.1 localhost localhost.localdomain localhost4 localhost4.localdomain4
::1 localhost localhost.localdomain localhost6 localhost6.localdomain6
10.1.24.172 n5
10.1.24.57 n6
10.1.24.71 n7
10.1.24.186 n8
关闭防所有服务器的火墙和 selinux
[root@n5 ~ ]# systemctl disable NetworkManager
[root@n5 ~ ]# sed -i ‘/SELINUX/s/enforcing/disabled/’ /etc/selinux/config
[root@n5 ~ ]# echo “* soft nofile 65536” >> /etc/security/limits.conf
[root@n5 ~ ]# echo “* hard nofile 65536” >> /etc/security/limits.conf
设置 epel 源、安装基本操作命令并同步时间:
[root@n5 ~]# yum install -y net-tools vim lrzsz tree screen lsof tcpdump wget ntpdate
[root@n5 ~]# cp /usr/share/zoneinfo/Asia/Shanghai /etc/localtime
[root@n5 ~]# echo “*/5 * * * * ntpdate time1.aliyun.com &> /dev/null && hwclock -w” >> /var/spool/cron/root
[root@n5 ~]# systemctl restart crond
[root@n5 ~]# reboot
在两台 ES 服务器准备 java 环境:
[root@n5 ~]# yum install -y java-1.8.0-openjdk
设置java环境(如果你是源码安装的话)
[root@n5 ~]# vim /etc/profile
export HISTTIMEFORMAT=”%F %T `whoami` “
export JAVA_HOME=JDK目录
export CLASSPATH=.:$JAVA_HOME/jre/lib/rt.jar:$JAVA_HOME/lib/dt.jar:$JAVA_HOME/lib/tools.jar
export PATH=$PATH:$JAVA_HOME/bin
[root@n5 ~]# source /etc/profile
[root@n5 ~]# java -version
openjdk version “1.8.0_222”
OpenJDK Runtime Environment (build 1.8.0_222-b10)
OpenJDK 64-Bit Server VM (build 25.222-b10, mixed mode)
2、官网下载 elasticsearch 并安装:
[root@n5 ~]# ll
total 300780
-rw——-. 1 root root 1331 Jul 14 17:40 anaconda-ks.cfg
-rw-r–r– 1 root root 284575102 Aug 22 09:50 elasticsearch-7.3.0-x86_64.rpm
-rw-r–r– 1 root root 23415665 Aug 22 10:55 phantomjs-2.1.1-linux-x86_64.tar.bz2
[root@n5 ~]# rpm -ivh elasticsearch-7.3.0-x86_64.rpm
## 编辑各elasticsearch服务器的服务配置文件
[root@n5 ~]# grep ‘^[a-Z]’ /etc/elasticsearch/elasticsearch.yml
cluster.name: es.cluster
node.name: n5
path.data: /var/lib/elasticsearch
path.logs: /var/log/elasticsearch
network.host: 0.0.0.0
http.port: 9200
discovery.seed_hosts: [“10.1.24.172”, “10.1.24.57”]
cluster.initial_master_nodes: [“10.1.24.172”, “10.1.24.57”]
http.cors.enabled: true
http.cors.allow-origin: “*”
[root@n6 ~]# grep ‘^[a-Z]’ /etc/elasticsearch/elasticsearch.yml
cluster.name: es.cluster
node.name: n6
path.data: /var/lib/elasticsearch
path.logs: /var/log/elasticsearch
network.host: 0.0.0.0
http.port: 9200
discovery.seed_hosts: [“10.1.24.172”, “10.1.24.57”]
cluster.initial_master_nodes: [“10.1.24.172”, “10.1.24.57”]
http.cors.enabled: true
http.cors.allow-origin: “*”
[root@linux-host2 ~]# systemctl restart elasticsearch
通过浏览器访问 elasticsearch 服务端口
3、安装 elasticsearch 插件之 head:(两台其中一台安装即可)
插件是为了完成不同的功能,官方提供了一些插件但大部分是收费的,另外也有一些开发爱好者提供的插件,可以实现对elasticsearch集群的状态监控与管理配置等功能。
Elasticsearch7.x版本不能使用命令直接安装head插件
# 修改配置文件/etc/elasticsearch/elasticsearch.yml增加参数
# 增加参数,使head插件可以访问es
[root@n5 ~]# vim /etc/elasticsearch/elasticsearch.yml
http.cors.enabled: true
http.cors.allow-origin: “*”
下载 head 插件 解压至 /usr/local 目录下
[root@n5 ~]# cd /usr/local
[root@n5 local ]# wget https://github.com/mobz/elasticsearch-head/archive/master.zip
[root@n5 local ]# unzip master.zip
安装 node
[root@n5 local ]# wget https://npm.taobao.org/mirrors/node/latest-v12.x/node-v12.0.0-linux-x64.tar.gz
[root@n5 local ]# tar -zxvf node-v12.0.0-linux-x64.tar.gz
如果你没法翻墙,你需要设置npm仓库为国内仓库
(1).临时使用
npm –registry https://registry.npm.taobao.org install express
(2).持久使用
npm config set registry https://registry.npm.taobao.org
修改环境变量 /etc/profile 添加
[root@n5 local ]# vim /etc/profile
export NODE_HOME=/usr/local/node-v12.0.0-linux-x64
export PATH=$PATH:$NODE_HOME/bin
export NODE_PATH=$NODE_HOME/lib/node_modules
#设置生效
[root@n5 local ]# source /etc/profile
安装 grunt
[root@n5 local ]# cd /usr/local/elasticsearch-head-master
[root@n5 local ]# npm install -g grunt-cli
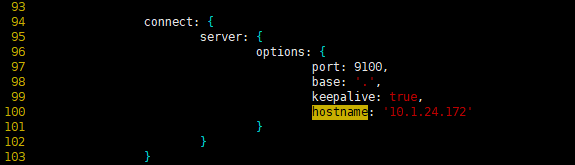
修改 head 插件源码 /usr/local/elasticsearch-head-master/Gruntfile.js
[root@n5 local ]# vim /usr/local/elasticsearch-head-master/Gruntfile.js
PS:hostname是新增的,不要忘记原有的true后面加,符号
connect: {
server: {
options: {
port: 9100,
base: ‘.’,
keepalive: true,
hostname: ‘10.1.24.172’
}
}
}
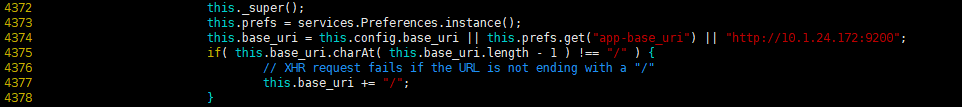
修改连接地址 /usr/local/elasticsearch-head-master/_site/app.js
[root@n5 local ]# vim /usr/local/elasticsearch-head-master/_site/app.js
4374 this.base_uri = this.config.base_uri || this.prefs.get(“app-base_uri”) || “http://10.1.24.172:9200”;
下载运行 head 必要的文件(放到文件夹/tmp/phantomjs/下面,没有就创建一个)
[root@n5 local]# cd /tmp/phantomjs/
[root@n5 phantomjs]# pwd
/tmp/phantomjs
[root@n5 ~]# wget https://bitbucket.org/ariya/phantomjs/downloads/phantomjs-2.1.1-linux-x86_64.tar.bz2
[root@n5 ~]# yum -y install bzip2
#运行head
[root@n5 ~]# cd /usr/local/elasticsearch-head-master
[root@n5 ~]# npm install
#后台启动
[root@n5 ~]# grunt server &
#设置开机自启
编辑启动脚本
[root@n5 elasticsearch-head-master]# cd /usr/local/elasticsearch-head-master/
[root@n5 elasticsearch-head]# vim elasticsearch-head
#!/bin/sh
# elasticsearch-head 的路径
cd /usr/local/elasticsearch-head
nohup npm run start >/usr/local/elasticsearch-head/nohup.out 2>&1 &
由systemd进行管理
[root@n5 elasticsearch-head]# cd /etc/systemd/system
[root@n5 system]# vim elasticsearch-head.service
[Unit]
Description=elasticsearch-head
After=network.target
[Service]
Type=forking
ExecStart=/usr/local/elasticsearch-head-master/elasticsearch-head
[Install]
WantedBy=multi-user.target
设置开机启动
[root@n5 system]# systemctl enable elasticsearch-head.service
[root@n5 system]# systemctl list-unit-files | grep elasticsearch-head.service
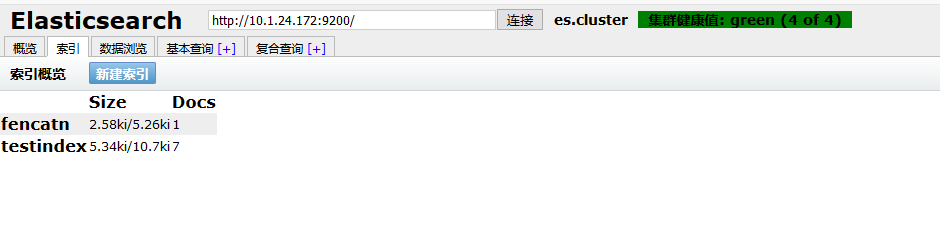
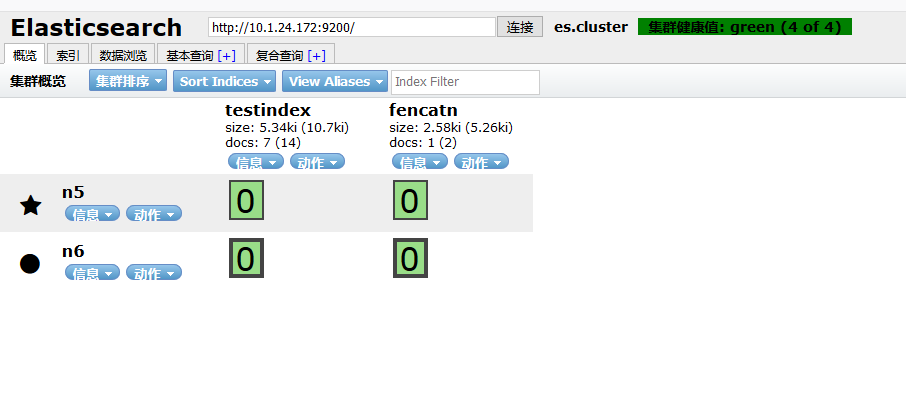
web 页面验证,http://192.168.66.15:9100
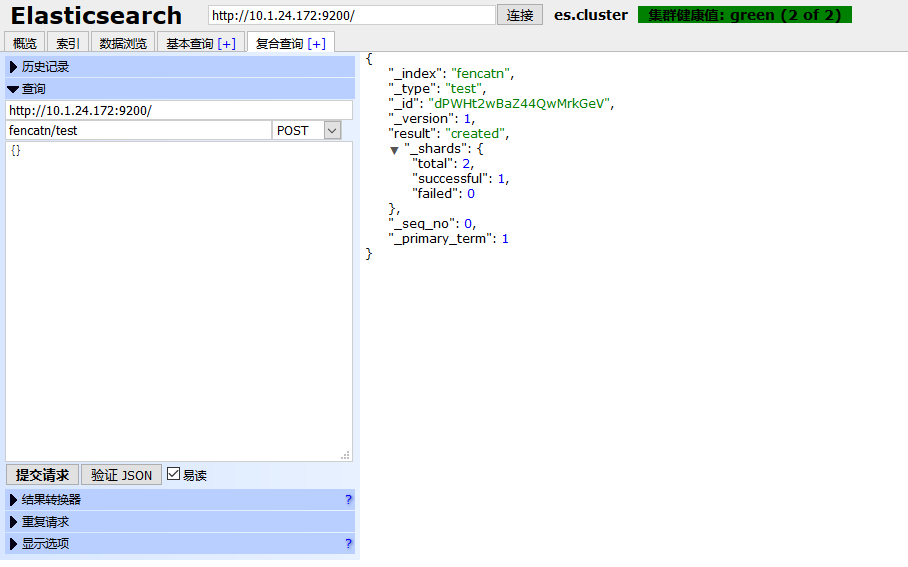
测试提交数据:

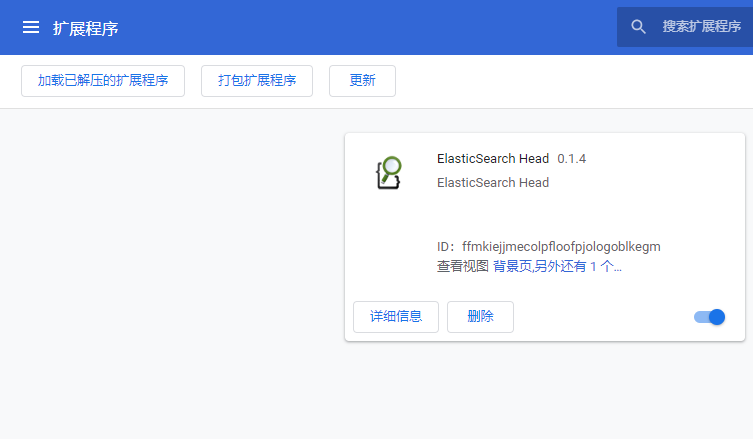
使用 Google 商店的 head 插件进行监控
前提是可以访问到谷歌商店
4、监控 elasticsearch 集群状态:
通过 shell 命令获取集群状态:
[root@n5 ~]# curl -sXGET http://10.1.24.172:9200/_cluster/health?pretty=true
{
“cluster_name” : “es.cluster”,
“status” : “green”,
“timed_out” : false,
“number_of_nodes” : 2,
“number_of_data_nodes” : 2,
“active_primary_shards” : 2,
“active_shards” : 4,
“relocating_shards” : 0,
“initializing_shards” : 0,
“unassigned_shards” : 0,
“delayed_unassigned_shards” : 0,
“number_of_pending_tasks” : 0,
“number_of_in_flight_fetch” : 0,
“task_max_waiting_in_queue_millis” : 0,
“active_shards_percent_as_number” : 100.0
}
[root@n5 ~]#
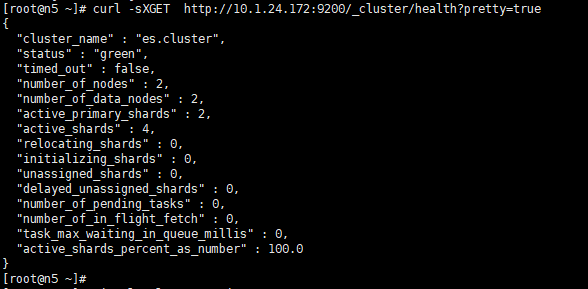
#获取到的是一个json格式的返回值,那就可以通过python对其中的信息进行分析,例如对status进行分析,如果等于green(绿色)就是运行在正常,等于yellow(×××)表示副本分片丢失,red(红色)表示主分片丢失
python 脚本
[root@n5 ~]# cat els-cluster-monitor.py
#!/usr/bin/env python
#coding:utf-8
import smtplib
from email.mime.text import MIMEText
from email.utils import formataddr
import subprocess
body = “”
false=”false”
obj = subprocess.Popen((“curl -sXGET http://10.1.24.172:9200/_cluster/health?pretty=true”),shell=True, stdout=subprocess.PIPE)
data = obj.stdout.read()
data1 = eval(data)
status = data1.get(“status”)
if status == “green”:
print “50”
else:
print “100”
[root@n5 ~]#
测试验证
[root@n5 ~]# python els-cluster-monitor.py
50