基于centos安装zabbix(官方文档)

1 Red Hat Enterprise Linux/CentOS

Overview

Official Zabbix packages are available for RHEL 7, CentOS 7 and Oracle Linux 7. In this documentation we will refer to all 3 using the term RHEL.

Some agent and proxy packages are available for RHEL 6 and RHEL 5 as well.

Adding Zabbix repository

Install the repository configuration package. This package contains yum (software package manager) configuration files.

RHEL 7:

# rpm -ivh https://repo.zabbix.com/zabbix/4.0/rhel/7/x86_64/zabbix-release-4.0-1.el7.noarch.rpm

RHEL 6:

# rpm -ivh https://repo.zabbix.com/zabbix/4.0/rhel/6/x86_64/zabbix-release-4.0-1.el6.noarch.rpm

RHEL 5:

# rpm -ivh https://repo.zabbix.com/zabbix/4.0/rhel/5/x86_64/zabbix-release-4.0-1.noarch.rpm

Frontend installation prerequisites

Zabbix frontend requires additional packages not available in basic installation. You need to enable repository of optional rpms in the system you will run Zabbix frontend on:

RHEL 7:

# yum-config-manager --enable rhel-7-server-optional-rpms

Server/proxy/frontend installation

To install Zabbix server (available for RHEL 7, deprecated on RHEL 6) with MySQL support:

# yum install zabbix-server-mysql

To install Zabbix proxy with MySQL support:

# yum install zabbix-proxy-mysql

To install Zabbix frontend (available for RHEL 7, deprecated on RHEL 6) with MySQL support:

# yum install zabbix-web-mysql

Substitute ‘mysql’ in the commands with ‘pgsql’ to use PostgreSQL, or with ‘sqlite3’ to use SQLite3 (proxy only).

Creating database

For Zabbix server and proxy daemons a database is required. It is not needed to run Zabbix agent.

Separate databases are needed for Zabbix server and Zabbix proxy; they cannot use the same database. Therefore, if they are installed on the same host, their databases must be created with different names!

Create the database using the provided instructions for MySQL or PostgreSQL.

Importing data

Now import initial schema and data for the server with MySQL:

# zcat /usr/share/doc/zabbix-server-mysql*/create.sql.gz | mysql -uzabbix -p zabbix

You will be prompted to enter your newly created database password.

With PostgreSQL:

# zcat /usr/share/doc/zabbix-server-pgsql*/create.sql.gz | sudo -u <username> psql zabbix

For proxy, import initial schema:

# zcat /usr/share/doc/zabbix-proxy-mysql*/schema.sql.gz | mysql -uzabbix -p zabbix

For proxy with PostgreSQL (or SQLite):

# zcat /usr/share/doc/zabbix-proxy-pgsql*/schema.sql.gz | sudo -u <username> psql zabbix
# zcat /usr/share/doc/zabbix-proxy-sqlite3*/schema.sql.gz | sqlite3 zabbix.db

Configure database for Zabbix server/proxy

Edit zabbix_server.conf (and zabbix_proxy.conf) to use their respective databases. For example:

# vi /etc/zabbix/zabbix_server.conf
DBHost=localhost
DBName=zabbix
DBUser=zabbix
DBPassword=<password>

In DBPassword use Zabbix database password for MySQL; PosgreSQL user password for PosgreSQL.

Use DBHost= with PostgreSQL. You might want to keep the default setting DBHost=localhost (or an IP address), but this would make PostgreSQL use a network socket for connecting to Zabbix. See SELinux configuration below for instructions.

Starting Zabbix server process

It’s time to start Zabbix server process:

# service zabbix-server start

and make it start at system boot:

RHEL 7 and later:

# systemctl enable zabbix-server

RHEL prior to 7:

# chkconfig --level 12345 zabbix-server on

Substitute ‘zabbix-server’ with ‘zabbix-proxy’ if you are installing Zabbix proxy.

Zabbix frontend configuration

For RHEL 7 and later the Apache configuration file for Zabbix frontend is located in /etc/httpd/conf.d/zabbix.conf.

If you use RHEL 6 please read the section about using Zabbix frontend on RHEL 6 on how to configure the frontend.

Some PHP settings are already configured. But it’s necessary to uncomment the “date.timezone” setting and set the right timezone for you.

php_value max_execution_time 300
php_value memory_limit 128M
php_value post_max_size 16M
php_value upload_max_filesize 2M
php_value max_input_time 300
php_value max_input_vars 10000
php_value always_populate_raw_post_data -1
# php_value date.timezone Europe/Riga

Now you are ready to proceed with frontend installation steps which will allow you to access your newly installed Zabbix.

Note that a Zabbix proxy does not have a frontend; it communicates with Zabbix server only.

Zabbix official repository provides fping, iksemel, libssh2 packages as well. These packages are located in the non-supported directory.

SELinux configuration

Having SELinux status enabled in enforcing mode, you need to execute the following commands to enable communication between Zabbix frontend and server:

RHEL 7 and later:

# setsebool -P httpd_can_connect_zabbix on
If the database is accessible over network (including 'localhost' in case of PostgreSQL), you need to allow Zabbix frontend to connect to the database too:
# setsebool -P httpd_can_network_connect_db on

RHEL prior to 7:

# setsebool -P httpd_can_network_connect on
# setsebool -P zabbix_can_network on

As frontend and SELinux configuration is done, you need to restart Apache web server:

# service httpd restart

Zabbix frontend and server on RHEL 6

Zabbix frontend on RHEL 6 is not supported because of PHP version. Since Zabbix 3.0 the requirements are to have PHP 5.4.0 or later while RHEL 6 latest version is 5.3.3 .

In most cases Zabbix server and frontend are installed on the same machine. When upgrading 2.2 to 3.0 Zabbix server will perform database upgrade and frontend will stop working. There is no way to roll back the database changes so users will be forced to upgrade PHP using 3rd party packages. This is why Zabbix server is also deprecated on RHEL 6.

If you still want to use Zabbix frontend on RHEL 6 and upgraded your PHP using 3rd party packages you would need to enable zabbix-deprecated repository first:

  • open file /etc/yum.repos.d/zabbix.repo
  • find section [zabbix-deprecated]
  • set enabled=1
  • save the file

You will have to do some more manual configuration. This is because we cannot identify the Apache version required for your PHP which makes it impossible for us to provide proper Apache configuration for Zabbix frontend. We have included 2 Apache configuration files to our zabbix-web package, one for Apache 2.2 and another for 2.4, which you would need to integrate with the Apache configuration yourself:

  • httpd22-example.conf
  • httpd24-example.conf

To get the full path to the files execute:

$ rpm -ql zabbix-web | grep example.conf

Agent installation

To install the agent, run

# yum install zabbix-agent

To start the agent, run:

# service zabbix-agent start

Java gateway installation

It is required to install Java gateway only if you want to monitor JMX applications. Java gateway is lightweight and does not require a database.

Once the required repository is added, you can install Zabbix Java gateway by running:

# yum install zabbix-java-gateway

Proceed to setup for more details on configuring and running Java gateway.

发表在 zabbix | 标签为 | 留下评论

Zabbix配置参数优化

Zabbix配置参数优化

转载自https://blog.51cto.com/allmrys/2286220

概述:使用zabbix监控服务器已有一段时间,监控的服务器不到100台,发现刷新zabbix页面有卡顿的现象。而且经常报“Zabbix poller processes more than 75% busy”的错误,检查服务器性能还是有保障的,最后发现zabbix_server.conf既然使用的是默认配置(懒得没有底线),zabbix_server.conf的很多配置都没有修改,赶紧脑补了一下,把主要的参数信息优化下。

一、Zabbix服务端的常用参数如下:(参数取值根据服务器配置)

参数 必填 范围 默认值 描述
CacheSize no 128K-8G 8M 缓存大小, 单位字节.
用于存储主机、监控项、触发器数据的共享内存大小.

服务器分配有4G

设置为:CacheSize=256M

CacheUpdateFrequency no 1-3600 60 Zabbix 缓存更新频率, 单位秒.60秒感觉太快了

设置为:CacheUpdateFrequency=180

DebugLevel no 0-5 3 指定调试等级:
0 – Zabxxi进程起停的基本信息
1 – 重要信息
2 – 错误信息
3 – 警告信息
4 – 调试 (产生大量信息)
5 – 扩展调试 (产生更多信息)
HistoryCacheSize no 128K-2G 16M 历史缓存数据大小, 单位字节.
存储历史数据.

设置为:HistoryCacheSize=64M

HistoryIndexCacheSize no 128K-2G 4M 历史索引缓存大小, 单位字节.
用于索引历史缓存中历史数据的共享内存大小.

缓存一个item大概需要索引的大小为100字节.item代表一个监控项,按照100000个监控项来算:100000*100/1024/1024=9.6M

设置为:HistoryIndexCacheSize=10M

HousekeepingFrequency no 0-24 1 Zabbix 执行 housekeeping 的频率 (单位小时).
从数据库中删除过期的信息.
注意: 为了防止 housekeeper 过载 (例如, 当历史和趋势周期大大减小时), 对于每一个item,不会在一个housek周期内删除超过4倍HousekeepingFrequency 的过时信息. 因此, 如果 HousekeepingFrequency 是 1, 一个周期内不会删除超过4小时的过时信息 (starting from the oldest entry) .
StartPollersUnreachable no 0-1000 1 不可达主机 (包括IPMI 和 Java)的轮询器实例数量。
设置为:StartPollersUnreachable=20 占总数20%足够
StartPollers no 0-1000 5 轮询器实例数量。根据具体情况设置大小

设置为:StartPollers=30

StartDiscoverers no 0-250 1 自动发现子进程实例个数。

设置为:StartDiscoverers=5

StartTrappers no 0-1000 5 trappers进程实例数量。
Trappers接受来自Zabbix发送者、主动agents和主动proxies的传入连接。
至少要运行一个trapper进程来显示前端的服务器可用性和视图队列。

设置为:StartTrappers=15

StartVMwareCollectors no 0-250 0 vmware 采集器的子进程实例个数,如果有虚拟机的话,记得开启。
Timeout no 1-30 3 agent, SNMP 设备或外部检查的超时时长(单位秒)。

设置为:Timeout=6

TrendCacheSize no 128K-2G 4M 趋势缓存的大小,单位字节。
用于存储趋势数据的共享内存大小。

设置为:128M

ValueCacheSize no 0,128K-64G 8M 历史数据缓存大小, 单位bytes.
缓存item历史数据请求的共享内存大小.
0即禁止缓存 (不建议).
当缓存大小超过共享内存时,每5分钟会向服务器日志写入一条警告信息.
设置为:ValueCacheSize=128M


二、Zabbix报错信息处理

1、Zabbix poller processes more than 75% busy:

2、 icmp pinger processes more than 75% busy

3、zabbix unreachable poller processes more than 75 busy 

4、zabbix的WEB界面刷新卡死

5、数据库连接超出

这类报错比较多,首先检查zabbix-server配置信息

StartPollers、StartDiscoverers、StartPingers、StartPollersUnreachable等等,根据上面的【Zabbix服务端的常用参数】核对下。

然后在检查:

根据服务器性能状态、队列、数据库配置信息
发表在 zabbix | 标签为 | 留下评论

磁盘使用率查看iostat命令解析

磁盘使用率查看iostat命令解析

iostat命令被用于监视系统输入输出设备和CPU的使用情况。它的特点是汇报磁盘活动统计情况,同时也会汇报出CPU使用情况。同vmstat一样,iostat也有一个弱点,就是它不能对某个进程进行深入分析,仅对系统的整体情况进行分析。

iostat –h
用法: iostat [ 选项 ] [ <时间间隔> [ <次数> ] ]
Options are:
[ -c ] [ -d ] [ -N ] [ -n ] [ -h ] [ -k | -m ] [ -t ] [ -V ] [ -x ] [ -y ] [ -z ]
[ -j { ID | LABEL | PATH | UUID | … } [ <device> […] | ALL ] ]
[ <device> […] | ALL ] [ -p [ <device> [,…] | ALL ] ]

语法
iostat(选项)(参数)
选项
-c:仅显示CPU使用情况;
-d:仅显示设备利用率;
-k:显示状态以千字节每秒为单位,而不使用块每秒;
-m:显示状态以兆字节每秒为单位;
-p:仅显示块设备和所有被使用的其他分区的状态;
-t:显示每个报告产生时的时间;
-V:显示版号并退出;
-x:显示扩展状态。

-N    显示磁盘阵列(LVM)信息
-n    显示NFS 使用情况

参数
间隔时间:每次报告的间隔时间(秒);
次数:显示报告的次数。
实例1
用iostat -x /dev/sda1来观看磁盘I/O的详细情况:

iostat -x /dev/sda1 

Linux 2.6.32-504.16.2.el6.x86_64 (host-)     2018年08月18日     _x86_64_    (64 CPU)

avg-cpu:  %user   %nice %system %iowait  %steal   %idle
3.55    0.01    1.43    0.00    0.00   95.01

Device:         rrqm/s   wrqm/s     r/s     w/s   rsec/s   wsec/s avgrq-sz avgqu-sz   await  svctm  %util
sda1              0.00     0.00    0.03    0.00     0.13     0.00     4.00     0.00    0.78   0.78   0.00

详细说明:第二行是系统信息和监测时间,第三行和第四行显示CPU使用情况(具体内容和mpstat命令相同)。
cpu属性值说明
%user:          CPU处在用户模式下的时间百分比。
%nice:          CPU处在带NICE值的用户模式下的时间百分比。
%system:    CPU处在系统模式下的时间百分比。
%iowait:      CPU等待输入输出完成时间的百分比。
%steal:      管理程序维护另一个虚拟处理器时,虚拟CPU的无意识等待时间百分比。
%idle:            CPU空闲时间百分比。

备注:如果%iowait的值过高,表示硬盘存在I/O瓶颈,%idle值高,表示CPU较空闲,如果%idle值高但系统响应慢时,有可能是CPU等待分配内存,此时应加大内存容量。
%idle值如果持续低于10,那么系统的CPU处理能力相对较低,表明系统中最需要解决的资源是CPU。

Device的I/O输出的信息,如下所示
标示    说明
Device    监测设备名称
rrqm/s    每秒需要读取需求的数量
wrqm/s    每秒需要写入需求的数量
r/s     每秒实际读取需求的数量
w/s    每秒实际写入需求的数量
rsec/s    每秒读取区段的数量
wsec/s    每秒写入区段的数量
rkB/s    每秒实际读取的大小,单位为KB
wkB/s    每秒实际写入的大小,单位为KB
avgrq-sz    需求的平均大小区段
avgqu-sz    需求的平均队列长度
await    等待I/O平均的时间(milliseconds)
svctm    I/O需求完成的平均时间
%util    被I/O需求消耗的CPU百分比

备注:如果 %util 接近 100%,说明产生的I/O请求太多,I/O系统已经满负荷,该磁盘可能存在瓶颈。
如果 svctm 比较接近 await,说明 I/O 几乎没有等待时间;如果 await 远大于 svctm,说明I/O 队列太长,io响应太慢,则需要进行必要优化。如果avgqu-sz比较大,也表示有当量io在等待。

实例2  
iostat -d -k 1 10
参数 -d 表示,显示设备(磁盘)使用状态;-k某些使用block为单位的列强制使用Kilobytes为单位;1表示,数据显示每隔1秒刷新一次。一共统计十次

Linux 2.6.32-504.16.2.el6.x86_64 (host-)     2018年08月18日     _x86_64_    (64 CPU)

Device:            tps    kB_read/s    kB_wrtn/s    kB_read    kB_wrtn
sda              34.64         5.12       751.12  412659496 60484078502
dm-1             40.87         0.02       163.46    1221797 13162174268
dm-2              9.73         0.01        38.92     469665 3133764096
dm-5             24.35         0.14        97.38   11560861 7841415860
dm-6              1.92         0.00         7.69      68873  619611252
dm-9              2.90         0.13        11.57   10432045  932056216
dm-8              1.83         0.00         7.34     112561  590833132
dm-3              1.56         0.00         6.24      71701  502570400
dm-4              0.78         0.00         3.11       4057  250112728
dm-0              0.52         0.05         2.08    3890005  167775376
dm-7             12.07         0.01        48.26     775113 3886483236
dm-10             0.25         0.00         1.02       1333   81837584

disk属性值说明:
tps:该设备每秒的传输次数(Indicate the number of transfers per second that were issued to the device.)。”一次传输”意思是”一次I/O请求”。多个逻辑请求可能会被合并为”一次I/O请求”。”一次传输”请求的大小是未知的。
kB_read/s:每秒从设备(drive expressed)读取的数据量;
kB_wrtn/s:每秒向设备(drive expressed)写入的数据量;
kB_read:读取的总数据量;
kB_wrtn:写入的总数量数据量;这些单位都为Kilobytes。

例子2中,我们可以看到磁盘sda以及它的各个分区的统计数据,当时统计的磁盘总TPS,下面是各个分区的TPS。(因为是瞬间值,所以总TPS并不严格等于各个分区TPS的总和)

指定监控的设备名称为sda,该命令的输出结果和上面命令完全相同。
iostat -d sda 2
默认监控所有的硬盘设备,现在指定只监控sda。

常见用法
iostat -d -k 1 10         #查看TPS和吞吐量信息(磁盘读写速度单位为KB)
iostat -d -m 2            #查看TPS和吞吐量信息(磁盘读写速度单位为MB)
iostat -d -x -k 1 10      #查看设备使用率(%util)、响应时间(await) iostat -c 1 10 #查看cpu状态

参考:
http://man.linuxde.net/iostat
https://www.cnblogs.com/ggjucheng/archive/2013/01/13/2858810.html
https://www.linuxidc.com/Linux/2014-07/104151.htm

发表在 LinuxBasic | 标签为 | 留下评论

Linux(CentOS) 如何查看当前占用CPU或内存最多的K个进程

Linux(CentOS) 如何查看当前占用CPU或内存最多的K个进程

一、可以使用以下命令查使用内存最多的K个进程

方法1:

ps -aux | sort -k4nr | head -K

如果是10个进程,K=10,如果是最高的三个,K=3

说明:ps -aux中(a指代all——所有的进程,u指代userid——执行该进程的用户id,x指代显示所有程序,不以终端机来区分)

ps -aux的输出格式如下:

主要是关注每一列是干嘛的,比如CPU是第3列,内存是第4列等等,你要看排行,那就要搞清楚哪一行是什么东西

[root@gateway project]# ps -aux
USER PID %CPU %MEM VSZ RSS TTY STAT START TIME COMMAND
root 1 0.0 0.2 125596 4188 ? Ss Jun04 0:01 /usr/lib/systemd/systemd --switched-root --system --deserialize 21
root 2 0.0 0.0 0 0 ? S Jun04 0:00 [kthreadd]
root 3 0.0 0.0 0 0 ? S Jun04 0:00 [ksoftirqd/0]

sort -k4nr中(k代表从第几个位置开始,后面的数字4即是其开始位置,结束位置如果没有,则默认到最后;n指代numberic sort,根据其数值排序;r指代reverse,这里是指反向比较结果,输出时默认从小到大,反向后从大到小。)。本例中,可以看到%MEM在第4个位置,根据%MEM的数值进行由大到小的排序。

head -K(K指代行数,即输出前几位的结果)

|为管道符号,将查询出的结果导到下面的命令中进行下一步的操作。

方法2:top (然后按下M,注意大写)

二、可以使用下面命令查使用CPU最多的K个进程

方法1:

ps -aux | sort -k3nr | head -K

方法2:top (然后按下P,注意大写)

发表在 LinuxBasic | 标签为 | 留下评论

jenkins远程部署springboot项目

jenkins远程部署springboot项目

转载自http://www.jetchen.cn/jenkins-deploy-springboot/,网上翻了一大堆,就这个攻略靠谱,原作者的脚本我改了一下,其实区别不同的也就是脚本而已,其他大同小异。感谢原作者

一、环境准备

① 想用 jenkins,首先的大前提是准备 java 的运行环境,就是装 jdk 。

② 如果你要打包的是 maven 项目,那么恭喜,本地还需要安装一个 maven。

③ 根据项目托管的环境,如果是 git,那么本地还需要安装 git。

二、基础配置

上述准备工作完事了之后,那就开心地安装 jenkins 吧。

安装完了之后,登陆,查看初始密码(初始密码在安装路径下的“\secrets\initialAdminPassword”文件内),然后可以选择安装一些基础的插件。

        ① 插件安装

如果有网,则可以在线安装,如果没有网络,则离线安装(建议在线安装,因为插件之间有关联,在线安装的话会帮你安装关联插件,离线的话则要根据提示的插件的依赖依续安装),提供一个下载插件的清华的源:https://mirrors.tuna.tsinghua.edu.cn/jenkins/plugins/

主要插件列表如下(在线安装时,这几个插件安装后会自动安装其依赖的插件):

git plugin:从Git拉代码

 Maven Integration plugin:如果需要使用 maven 来打包的话

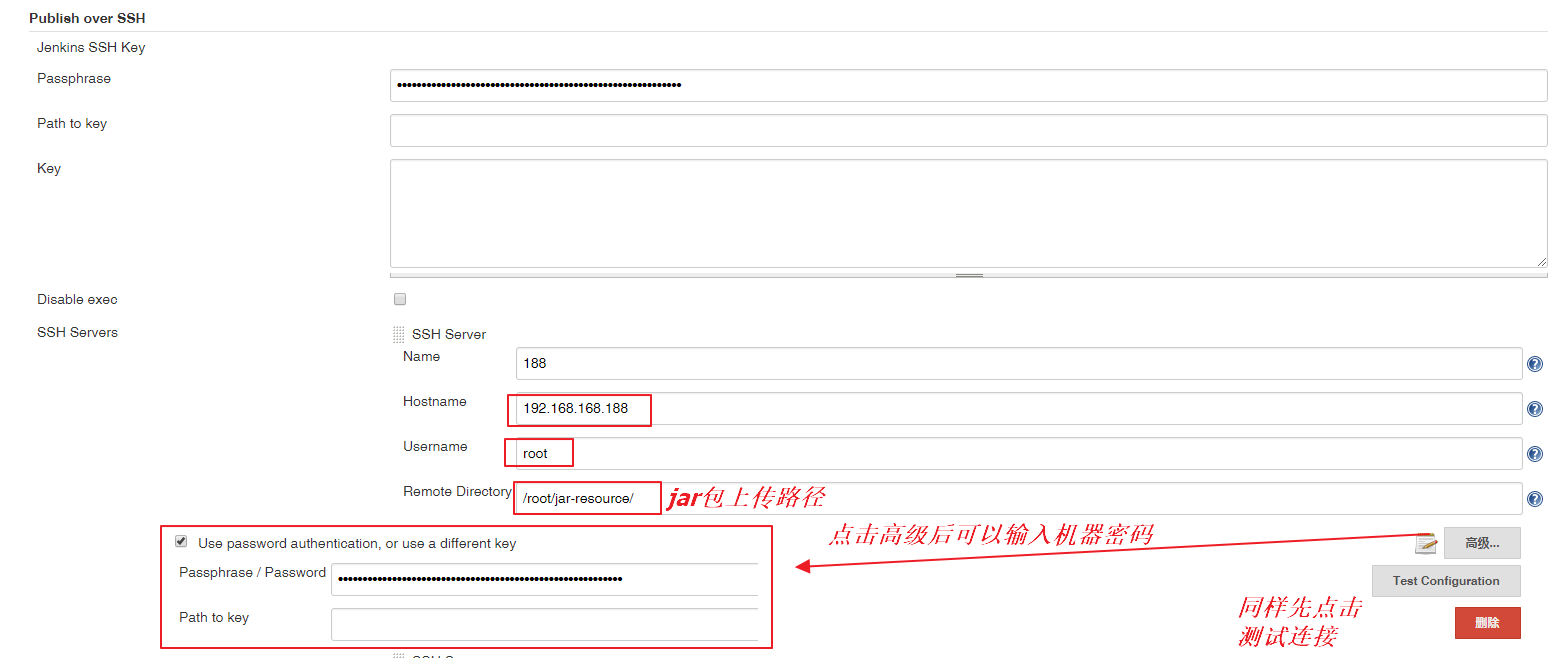
 Publish Over SSH:如果需要将打包好的代码上传到远程的话

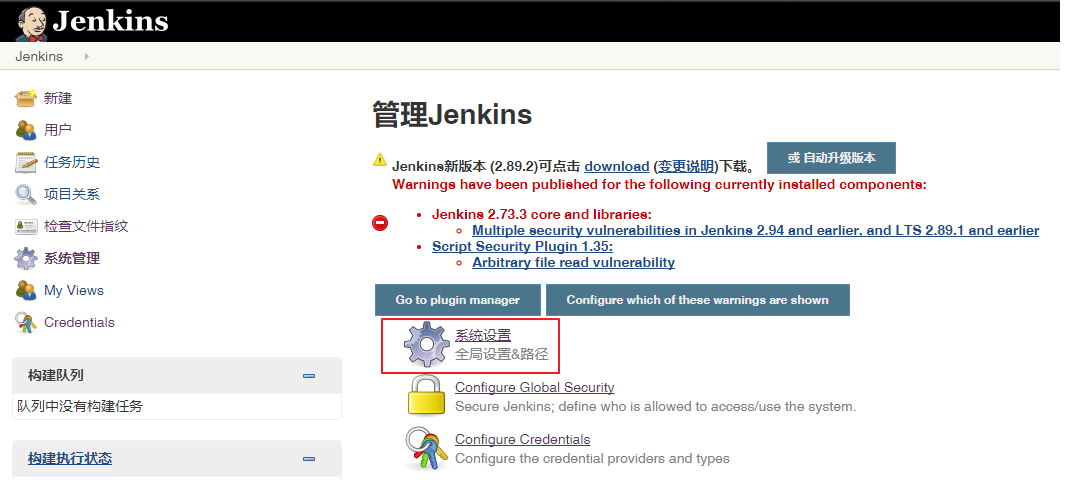
        ② 全局配置

如下仅列出了两项,其它的例如 git 的秘钥配置,暂不赘述


三、创建任务

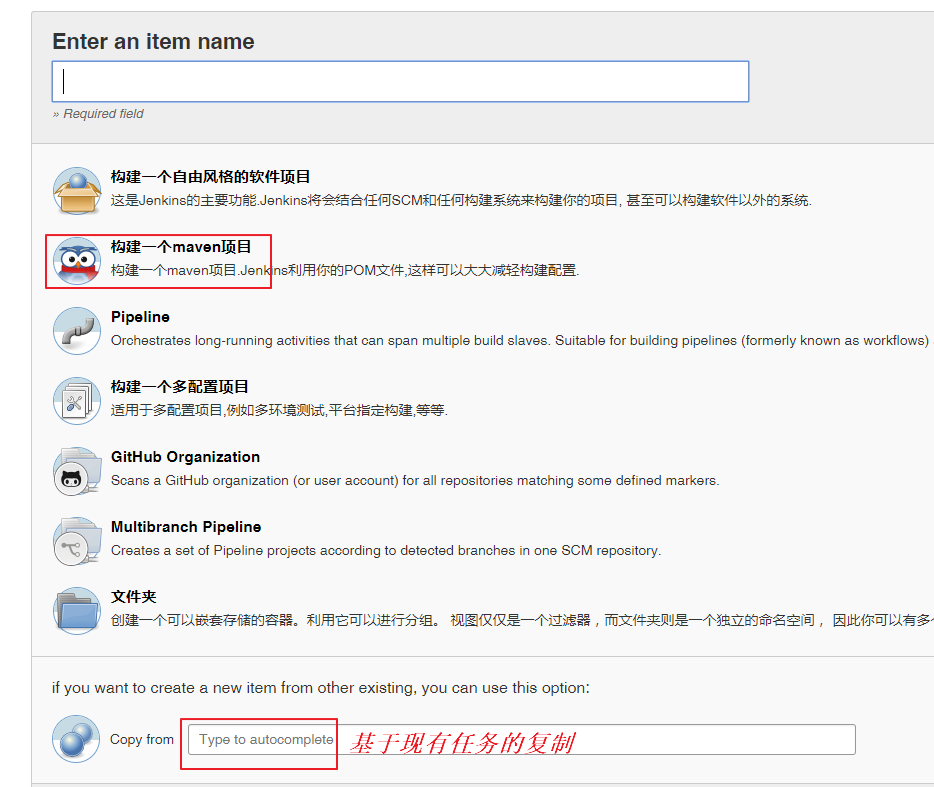
新建任务时可以新建基于 maven 的任务,也可以复制一个已有的任务来进行更改,

jenkins06.png

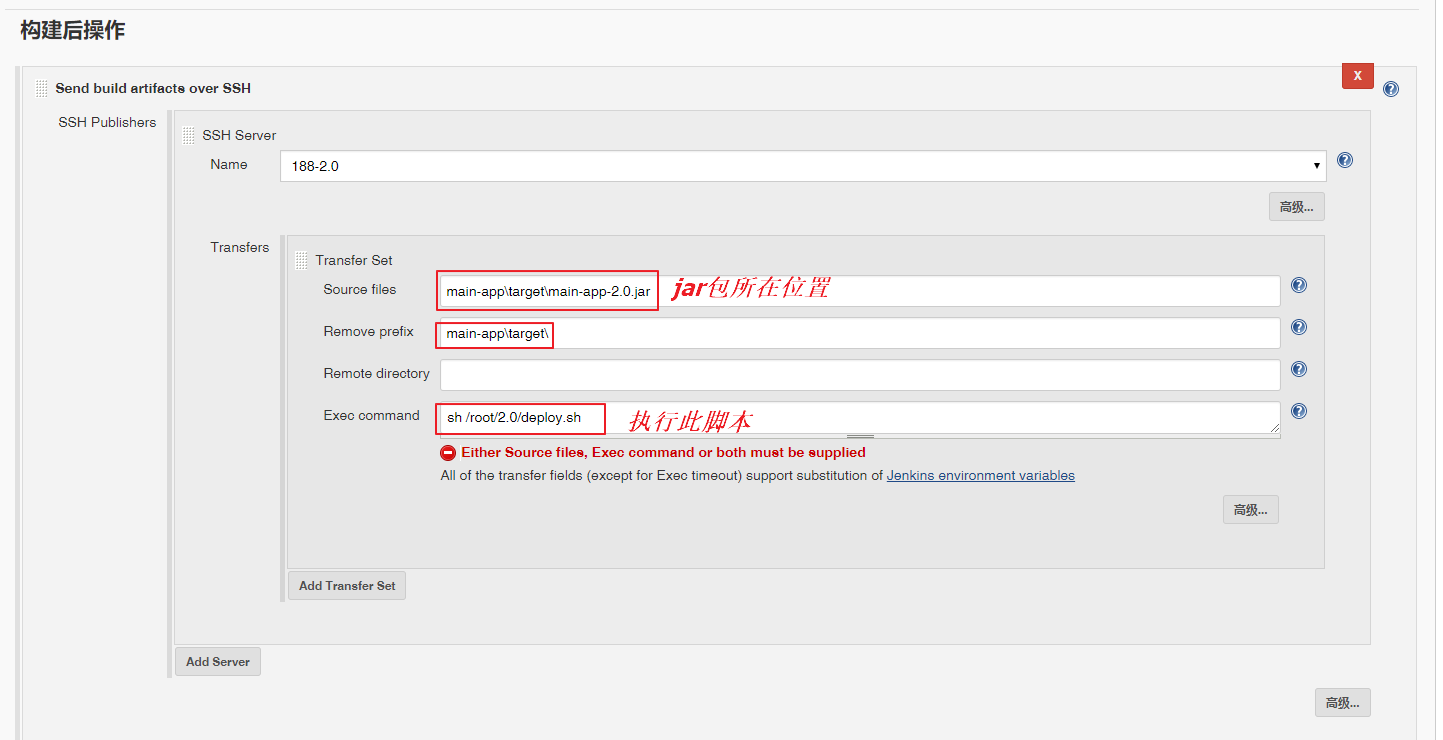
任务的新建不难,再次列两个需要注意的点:


四、shell 脚本

deploy.sh

[root@gateway project]# cat start.sh 
#!/bin/bash
jarfile=gateway-center-0.0.1-SNAPSHOT.jar
export JAVA_HOME=/usr/lib/jvm/java-11-openjdk-11.0.3.7-0.el7_6.x86_64
echo "执行....."
nohup ${JAVA_HOME}/bin/java -jar /root/$jarfile &
发表在 jenkins | 标签为 | 留下评论

CentOS7使用firewalld打开关闭防火墙与端口

CentOS7使用firewalld打开关闭防火墙与端口
1、firewalld的基本使用
启动: systemctl start firewalld
关闭: systemctl stop firewalld
查看状态: systemctl status firewalld
开机禁用 : systemctl disable firewalld
开机启用 : systemctl enable firewalld

2.systemctl是CentOS7的服务管理工具中主要的工具,它融合之前service和chkconfig的功能于一体。

启动一个服务:systemctl start firewalld.service
关闭一个服务:systemctl stop firewalld.service
重启一个服务:systemctl restart firewalld.service
显示一个服务的状态:systemctl status firewalld.service
在开机时启用一个服务:systemctl enable firewalld.service
在开机时禁用一个服务:systemctl disable firewalld.service
查看服务是否开机启动:systemctl is-enabled firewalld.service
查看已启动的服务列表:systemctl list-unit-files|grep enabled
查看启动失败的服务列表:systemctl –failed

3.配置firewalld-cmd
查看版本: firewall-cmd –version
查看帮助: firewall-cmd –help
显示状态: firewall-cmd –state
查看所有打开的端口: firewall-cmd –zone=public –list-ports
更新防火墙规则: firewall-cmd –reload
查看区域信息: firewall-cmd –get-active-zones
查看指定接口所属区域: firewall-cmd –get-zone-of-interface=eth0
拒绝所有包:firewall-cmd –panic-on
取消拒绝状态: firewall-cmd –panic-off
查看是否拒绝: firewall-cmd –query-panic

那怎么开启一个端口呢
添加
firewall-cmd –zone=public –add-port=80/tcp –permanent (–permanent永久生效,没有此参数重启后失效)
重新载入
firewall-cmd –reload
查看
firewall-cmd –zone= public –query-port=80/tcp
删除
firewall-cmd –zone= public –remove-port=80/tcp –permanent

发表在 centos-firewalld | 标签为 | 留下评论

centos服务器修改时区timezone

对于部署在海外的Linux服务器来说,拿到的机器时区和本地并不一样,导致运行在上面的应用也面临时区问题。所以有必要修改系统本地时区。

1. 查看时区
查看当前生效的时区,可以简单的通过date命令查看当前时间:

[root@server ~]# date -R
Thu, 06 Jun 2019 10:31:43 +0800
最后的+0800,即东8区。

2. 设置时区
然并卵的tzselect命令
看起来很像一个时区选择的工具,但并非如此。事实上tzselect仅仅是一个查看时区表示方式的『向导』程序而已。通过依次询问大洲→国家→城市,最后告诉你如何TZ变量的写法,比如北京时间是:Asia/Shanghai

TZ变量
可以通过修改TZ变量,直接修改时区信息,比如:

[root@server ~]# date -R
Thu, 06 Jun 2019 10:31:43 +0800
有Linux经验的小伙伴都知道,不写在文件里的设置更改很难生效一般是会话级的,重新登录会消失。所以,这样直接修改TZ的尿性绝对做不到持久化更改时区的。

正确的方式是到/etc/profile里(或用户的.profile或.bashrc文件),直接export TZ变量为要更改的时区(时区的名字可以用tzselect向导来确定)

/etc/localtime文件
默认情况下情况下,TZ属性是空,这时候是靠/etc/localtime文件来确定的时区。而此文件通常又是一个到/usr/share/zoneinfo/下各种时区文件的软连接。通过修改/etc/localtime指向的软连接,进而修改系统的时区。比如下面的方法,将localtime文件设置为了北京时间:

ln -sf /usr/share/zoneinfo/Asia/Shanghai /etc/localtime
3. 总结
tzselect命令无法修改时区,仅给出时区的城市表示法
TZ变量和/etc/localtime文件会影响时区,并建议直接修改/etc/localtime文件。
如果在shell中临时需要变更时区信息,可以修改TZ变量实现。
在profile文件里设置变量TZ,达到和修改/etc/localtime类似的效果。

发表在 LinuxBasic | 标签为 | 留下评论

centos时区查看命令

[root@server ~]# tzselect
Please identify a location so that time zone rules can be set correctly.
Please select a continent or ocean.
1) Africa
2) Americas
3) Antarctica
4) Arctic Ocean
5) Asia
6) Atlantic Ocean
7) Australia
8) Europe
9) Indian Ocean
10) Pacific Ocean
11) none – I want to specify the time zone using the Posix TZ format.
#? 5
Please select a country.
1) Afghanistan 18) Israel 35) Palestine
2) Armenia 19) Japan 36) Philippines
3) Azerbaijan 20) Jordan 37) Qatar
4) Bahrain 21) Kazakhstan 38) Russia
5) Bangladesh 22) Korea (North) 39) Saudi Arabia
6) Bhutan 23) Korea (South) 40) Singapore
7) Brunei 24) Kuwait 41) Sri Lanka
8) Cambodia 25) Kyrgyzstan 42) Syria
9) China 26) Laos 43) Taiwan
10) Cyprus 27) Lebanon 44) Tajikistan
11) East Timor 28) Macau 45) Thailand
12) Georgia 29) Malaysia 46) Turkmenistan
13) Hong Kong 30) Mongolia 47) United Arab Emirates
14) India 31) Myanmar (Burma) 48) Uzbekistan
15) Indonesia 32) Nepal 49) Vietnam
16) Iran 33) Oman 50) Yemen
17) Iraq 34) Pakistan
#? 9
Please select one of the following time zone regions.
1) Beijing Time
2) Xinjiang Time
#? 1

The following information has been given:

China
Beijing Time

Therefore TZ=’Asia/Shanghai’ will be used.
Local time is now: Thu Jun 6 09:23:56 CST 2019.
Universal Time is now: Thu Jun 6 01:23:56 UTC 2019.
Is the above information OK?
1) Yes
2) No
#? 1

You can make this change permanent for yourself by appending the line
TZ=’Asia/Shanghai’; export TZ
to the file ‘.profile’ in your home directory; then log out and log in again.

Here is that TZ value again, this time on standard output so that you
can use the /usr/bin/tzselect command in shell scripts:
Asia/Shanghai

发表在 LinuxBasic | 标签为 | 留下评论

Linux下查看JDK安装路径

工作中经常要查看软件的安装路径,以下是常见的查看方法,文章转自https://www.cnblogs.com/imyalost/p/8745137.html,感谢原作者

在安装好Git、JDK和jenkins之后,就需要在jenkins中进行对应的设置,比如在全局工具配置模块,需要写入JDK的安装路径。

这篇博客,介绍几种常见的在Linux中查看JDK路径的方法。。。

1、which java

首先输入命令行,查看结果:

[root@localhost ~]# which java

/usr/bin/java

PS:which Java是无法定位到Java的安装路径的,只能定位到执行路径;whereis Java也无法定位,只能展示一部分的Java路径,如下所示:

[root@localhost ~]# whereis java

java: /usr/bin/java /usr/lib/java /etc/java /usr/share/java /usr/share/man/man1/java.1.gz

2、echo $JAVA_HOME

使用 echo $JAVA_HOME 命令可以定位到Java安装路径,但是前提是配置了环境变量$JAVA_HOME,否则还是定位不到,如下所示:

[root@localhost ~]# java -version
openjdk version "1.8.0_161"
OpenJDK Runtime Environment (build 1.8.0_161-b14)
OpenJDK 64-Bit Server VM (build 25.161-b14, mixed mode)
[root@localhost ~]# echo $JAVA_HOME

[root@localhost ~]#

3、rpm -qa | grep java

如果JDK是源码安装,那么rpm -qa | grep java命令也是定位不到的jdk的安装路径的,比如我是用的yum命令安装,使用rpm -qa | grep java命令的话,结果如下所示:

[root@localhost ~]# rpm -qa | grep java
javapackages-tools-3.4.1-11.el7.noarch
java-1.8.0-openjdk-headless-1.8.0.161-0.b14.el7_4.x86_64
tzdata-java-2018d-1.el7.noarch
java-1.8.0-openjdk-devel-1.8.0.161-0.b14.el7_4.x86_64
java-1.8.0-openjdk-1.8.0.161-0.b14.el7_4.x86_64
java-1.7.0-openjdk-1.7.0.171-2.6.13.0.el7_4.x86_64
python-javapackages-3.4.1-11.el7.noarch
java-1.7.0-openjdk-headless-1.7.0.171-2.6.13.0.el7_4.x86_64
[root@localhost ~]#

4、ls -lrt

先了解下ls命令:

-a 显示所有文件及目录 (ls内定将文件名或目录名称开头为"."的视为隐藏档,不会列出)

-l 除文件名称外,亦将文件型态、权限、拥有者、文件大小等资讯详细列出

-r 将文件以相反次序显示(原定依英文字母次序)

-t 将文件依建立时间之先后次序列出

-A 同 -a ,但不列出 "." (目前目录) 及 ".." (父目录)

-F 在列出的文件名称后加一符号;例如可执行档则加 "*", 目录则加 "/"

-R 若目录下有文件,则以下之文件亦皆依序列出


根据上面的命令,我们可以执行如下命令,找到JDK的安装路径:

[root@localhost ~]# ls -lrt /usr/bin/java
lrwxrwxrwx 1 root root 22 Apr 3 19:30 /usr/bin/java -> /etc/alternatives/java
[root@localhost ~]# ls -lrt /etc/alternatives/java
lrwxrwxrwx 1 root root 73 Apr 3 19:30 /etc/alternatives/java -> /usr/lib/jvm/java-1.8.0-openjdk-1.8.0.161-0.b14.el7_4.x86_64/jre/bin/java
[root@localhost ~]# cd /usr/lib/jvm
[root@localhost ~]# ls
java jre-1.7.0
java-1.7.0-openjdk-1.7.0.171-2.6.13.0.el7_4.x86_64 jre-1.7.0-openjdk
java-1.8.0 jre-1.7.0-openjdk-1.7.0.171-2.6.13.0.el7_4.x86_64
java-1.8.0-openjdk jre-1.8.0
java-1.8.0-openjdk-1.8.0.161-0.b14.el7_4.x86_64 jre-1.8.0-openjdk
java-openjdk jre-1.8.0-openjdk-1.8.0.161-0.b14.el7_4.x86_64
jre jre-openjdk

ls -lrt解析:即将文件以建立时间先后顺序的倒叙排列显示,从上面的结果可以看出,/usr/bin/java是执行路径,那么继续执行后面的文件路径,即可找到JDK的安装路径为/usr/lib/jvm/java-1.8.0。

PS:上面提到的几种方法,适用于安装在Linux上的软件查询路径使用(并不仅仅限于查找JDK安装路径),请选择合适的方法。。。

发表在 jdk | 标签为 | 留下评论

Mysql cannot allocate memory for the buffer pool 解决方法

今天打开网站提示数据库连接失败,吓我一跳,赶紧查日志,果然数据库服务挂了,具体日志如下

190605 8:35:19 [Note] /usr/libexec/mysqld (mysqld 5.5.56-MariaDB) starting as process 10509 …
190605 8:35:19 InnoDB: The InnoDB memory heap is disabled
190605 8:35:19 InnoDB: Mutexes and rw_locks use GCC atomic builtins
190605 8:35:19 InnoDB: Compressed tables use zlib 1.2.7
190605 8:35:19 InnoDB: Using Linux native AIO
190605 8:35:19 InnoDB: Initializing buffer pool, size = 128.0M
InnoDB: mmap(137756672 bytes) failed; errno 12
190605 8:35:19 InnoDB: Completed initialization of buffer pool
190605 8:35:19 InnoDB: Fatal error: cannot allocate memory for the buffer pool
190605 8:35:19 [ERROR] Plugin ‘InnoDB’ init function returned error.
190605 8:35:19 [ERROR] Plugin ‘InnoDB’ registration as a STORAGE ENGINE failed.
190605 8:35:19 [ERROR] mysqld: Out of memory (Needed 128917504 bytes)
190605 8:35:19 [Note] Plugin ‘FEEDBACK’ is disabled.
190605 8:35:19 [ERROR] Unknown/unsupported storage engine: InnoDB
190605 8:35:19 [ERROR] Aborting

190605 8:35:19 [Note] /usr/libexec/mysqld: Shutdown complete

190605 08:35:19 mysqld_safe mysqld from pid file /var/run/mariadb/mariadb.pid ended

大致的意思,就是没法为缓存池分配128M的内存。这个嘛,可以理解,这台主机只有1G内存,好吧,查查资料,说这个缓存池主要用来缓存innodb的索引,好了,不废话了,怎么解决呢

在配置文件中,有一个选项是用来调整缓存大小的,如果你没有这个选项,或者注释了,那默认就是128M,具体你可以去查查文档。所以,你要么把这个值改小一点,比如50M。我选择重启服务器。

innodb_buffer_pool_size = 128M

如果你还要进一步优化,很简单:1,加内存;2,加虚拟缓存。后者治标,前者治本。

发表在 mysql | 标签为 | 留下评论